The Gang Reverse-Engineers the Beta Sim
If you’re a huge Blaseball nerd, in the past months you may have heard of a steady stream of discoveries about the Blaseball sim, despite the fact that games aren’t going. You may have also heard these discoveries attributed to “RNG research”, without knowing what that means. It’s time we demystified one of SIBR’s most ambitious and technical projects to date.
The Sim
To understand RNG research, first you need to know the broad strokes of how the Blaseball sim works under the hood. We don’t yet understand every minute detail, and what we do understand is pretty complex, so this will be a simplified approximation.
Every 5 seconds, while games are running, the sim generates the next game update for each game1. Sometimes the next event is predetermined. For example, the first two will always be “Let’s go!” and “Play ball!”, a batter-up event will always happen after a non-inning-ending plate appearance ends, Fax Machine happens automatically if the away team has 10 or more runs in a qualifying ballpark, etc. Those events are 100% consistent so the logic behind them is easy to solve. Most events, however, have some randomness behind them. Figuring out exactly how this randomness translates into game events is the goal of the RNG research.
Most of the logic happens as a series of binary (yes-or-no) decisions. For example, “does a weather event happen?“. If yes, that event becomes a weather event (and for most weathers there are more rolls to determine the details of the event). If no, the sim goes on to the next question: for each baserunner, do they try to steal? If yes, this event is either a Stolen Base or a Caught Stealing event (and another roll is used to decide which). If not, it moves on to the pitch: is the pitch in the strike zone? Then, does the batter swing? If so, do they make contact with the ball? The answers to those rolls are used in combination to determine if this is a Ball (no and no), a Strike, Looking (yes and no), a Strike, Swinging (either, yes, and no) or contact (either, yes, and yes), in which case the sim proceeds to more questions. This continues until it has determined what happens in this game event.
Each of these binary decisions is random, and has a certain probability of being answered with “yes”. Sometimes these probabilities are really low — weather events are very unlikely in Eclipse weather, and a bit more likely in Flooding weather (remember, this decision is being made once per game update, and the vast majority of game updates aren’t Incinerations). Other probabilities are pretty high — an elite pitcher is very likely to get the ball in the strike zone. Nearly all the randomness in the sim comes from these random decisions with various probabilities. (Almost all the rest comes from randomly choosing from a list, like choosing which fielder caught a Flyout.)
There’s an easy way for computers to make a decision with unequal probability like this. You express your probability as a number between 0 and 1, then you generate a random number between 0 and 1. If the number is less than your probability, the answer is “yes”. Otherwise, the answer is “no”. When we’re using this technique we tend to refer to the probability as the “threshold”.
This is a very common technique, and it wasn’t difficult to guess that Blaseball would use it. What is difficult is figuring out which checks they’re making, and after that, how they’re computing the thresholds. All we can see is the output of this process; without also being able to see the input, there’s little we can do other than speculate. In this case the “input” is the random numbers that were generated, and to get our hands on those we’d need to do something wild like break the RNG.
Breaking the RNG
Computers are actually pretty bad at randomness. After all, a computer is a machine that outputs exactly what you tell it to, and the point of randomness is that you don’t know what it’s going to be until you see it. There are some neat ways of making a computer measure some randomness from the world and convert it into a number, but those tend to be way too slow for a game. So, we cheat. We generate numbers that look random, but if you know the algorithm that generates them, you can perfectly predict what they’re going to be. These are called pseudo-random numbers, and the algorithms that generate them are called Pseudo-Random Number Generators, or PRNGs. Because programmers are lazy people, we often don’t say the “pseudo” part and just call them RNGs.
The blaseball RNG (which is called XorShift128+ and is really a PRNG) works the way most of them do: you give it an actual random number2 to start with, and then it generates a new number by scrambling the one you gave it. Then it generates the next number by scrambling the previous one, etc. The scrambling process performs the same steps each time, but as long as it’s a good quality scramble you won’t be able to notice a pattern and so the numbers will appear random. One trick that many PRNGs do, including Blaseball’s, is to use more digits than you need when they’re doing their internal work and then only give you some of the digits each time you ask them for a random number. If they didn’t do this, every time you saw a particular number it would always be followed by the same next number. As the name implies, XorShift128+ uses 128 bits even though a number between 0 and 1 only needs 52 bits3.
That paragraph above means that if we can figure out the 128-bit internal state of the RNG at any point in time, we can then predict the next number, and the next, and so on, forever. All we need is some way to get that state.
Enter this article (and the follow-up) by Douglas Goddard. It describes how to use a tool called a constraint solver to figure out the state of Chrome’s internal RNG, which is the same RNG that Blaseball uses. If you can get several outputs of the RNG in a row, you can put them into a constraint solver and ask it, “what internal RNG state would give us these outputs, in this order?” and, if it has enough data, it will tell you. That’s really cool! Now all we need is a bunch of random numbers between 0 and 1 that the sim generated one immediately after another.
It turns out that when a new player is hatched, from incineration or any other source, their attributes are random numbers directly from the RNG. After some trial-and-error to figure out the order in which attributes are generated, we were able to find the RNG seed for the new egg hatching after an incineration. And this RNG can be run in reverse, so we could back up a few rolls and notice that there was always a really low number exactly 3 rolls before the first attribute value. This was the eclipse weather roll, and it was the first game update roll we ever located.
Since then we’ve figured out a lot more, like how to find random stat changes such as parties and shadow boosts. We’ve also discovered that incinerations are connected to each other: if you find one incineration, and then run the RNG forwards for a while, you’ll get to the next incineration (unless the sim was rebooted in the meantime — that resets the RNG).
Using the solver to derive the RNG state from player generations let us figure out how incinerations work, but it was highly specific to events where a player was born or a player had a random4 boost or, uh, unboost? Whatever you call that. To figure out all the other events we needed another way to find them.
Help from the Birds
We could look forward and backwards from the incineration and boost events to get a tiny amount of data, but those were too few and far between to figure out how the rolls and the game events related to each other. For that we needed something that could happen much more often, yet was still able to be located in the RNG stream. Enter: birds.
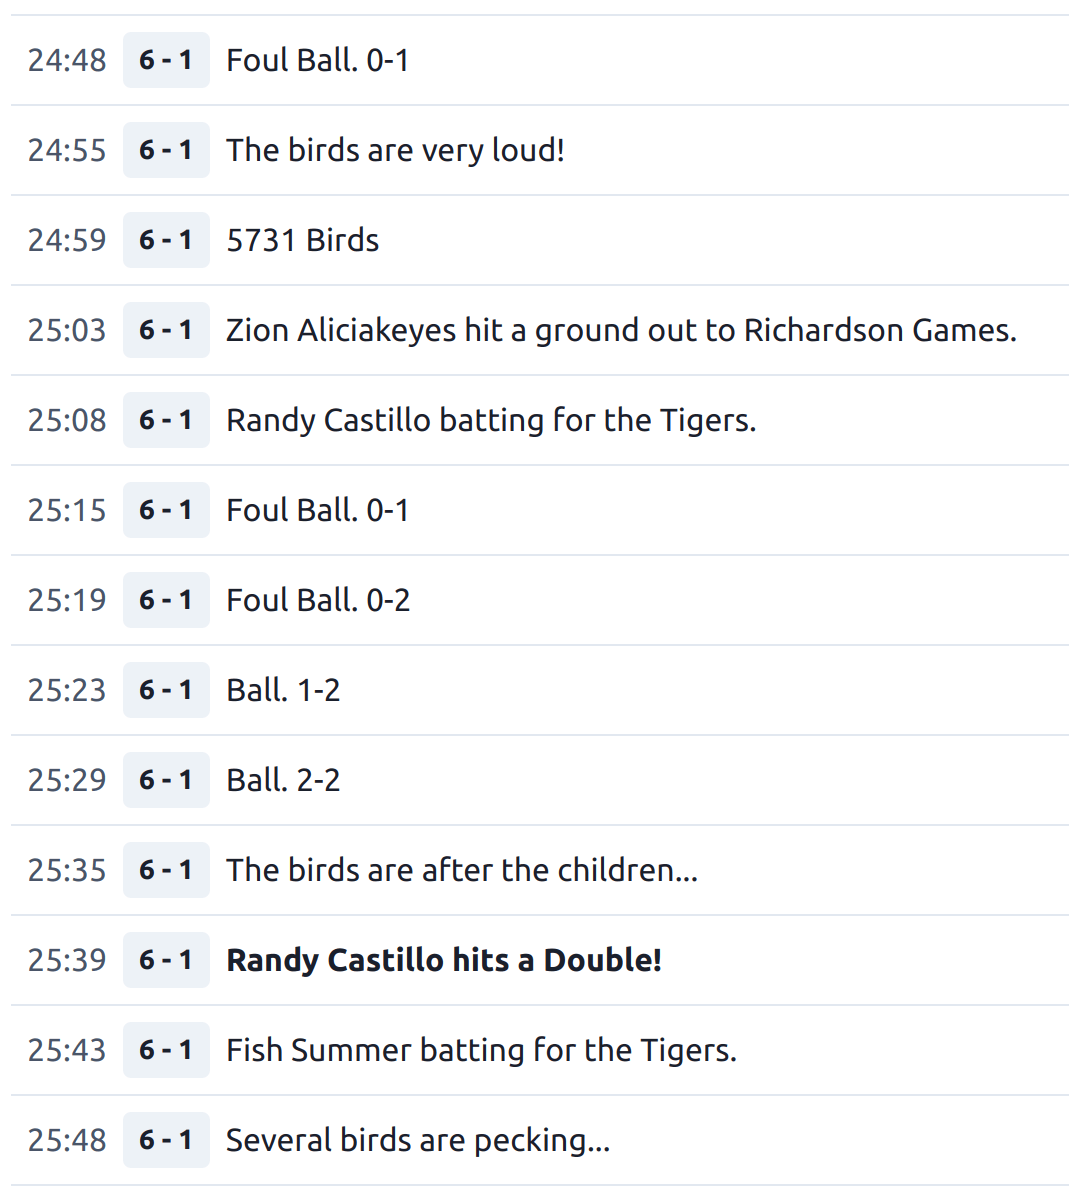
Bird flavor messages can happen many times per game, sometimes with only a few events in between. And, crucially, one of the messages has a random number of birds in it. No prizes for guessing where that random number comes from. It’s not enough data5 to solve for the RNG state the way we did for incinerations, but it is specific enough that we can start at a known RNG state and scan forward until we find one that matches. We also know that this message only shows if the “does a weather event happen?” check passed, and that check has a pretty low threshold, so there must be a pretty low roll very close before. We scanned for this pattern and found the location of two Birds games in the Season 3 finals.
With the location of a birds game, we could then scan around for the signature of the other messages6. From there we could find places where only one event happened between the two messages, so we knew exactly how long that event was. Other times we had to set up equations: If you know that 1 Ball + 2 Strikes, Looking = 12 events and 2 Balls + 3 Strikes, Looking = 19 events, you can solve it as a system of linear equations. Using this technique, some guess-and-check, and a lot of elbow grease we were able to narrow down the durations of most event types.
But what do they mean?
We now know which RNG rolls belong to each event, but the next question is: how are they used? We can presume that they use the threshold method, but which questions are they asking and what are the thresholds they’re using?
Well, to answer the first one, you can stare at the numbers very hard. Or, you can make graphs! For example, if we only look at Balls and Strikes, Looking, we always know whether the pitch was in the strike zone. The first roll is the weather check, so let’s plot the second roll, with Strikes plotted as blue diamonds and Balls as red dots.
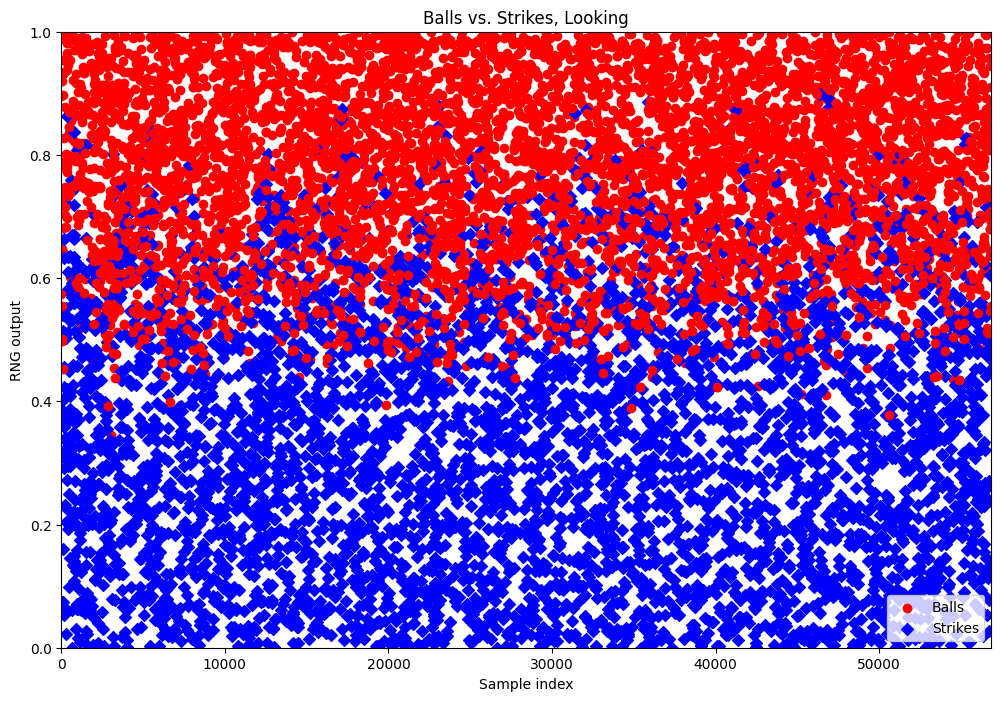
That looks like something! The blue diamonds are mostly towards the bottom, and
the red dots are mostly towards the top. This is what we in the business call
poggers a correlation. It’s far from a clean separation, though. That’s
because the threshold is different every time. A pitcher who’s better at
throwing strikes has a higher threshold than one who’s bad at it. Our next
move is to try to figure out how that threshold works. We’re not using the x
axis for anything useful so let’s plot, say, pitcher ruthlessness. And,
because I’m writing this from the future and I already know how we did it,
let’s exclude every sample where the pitcher or batter has a mod that affects
attributes.
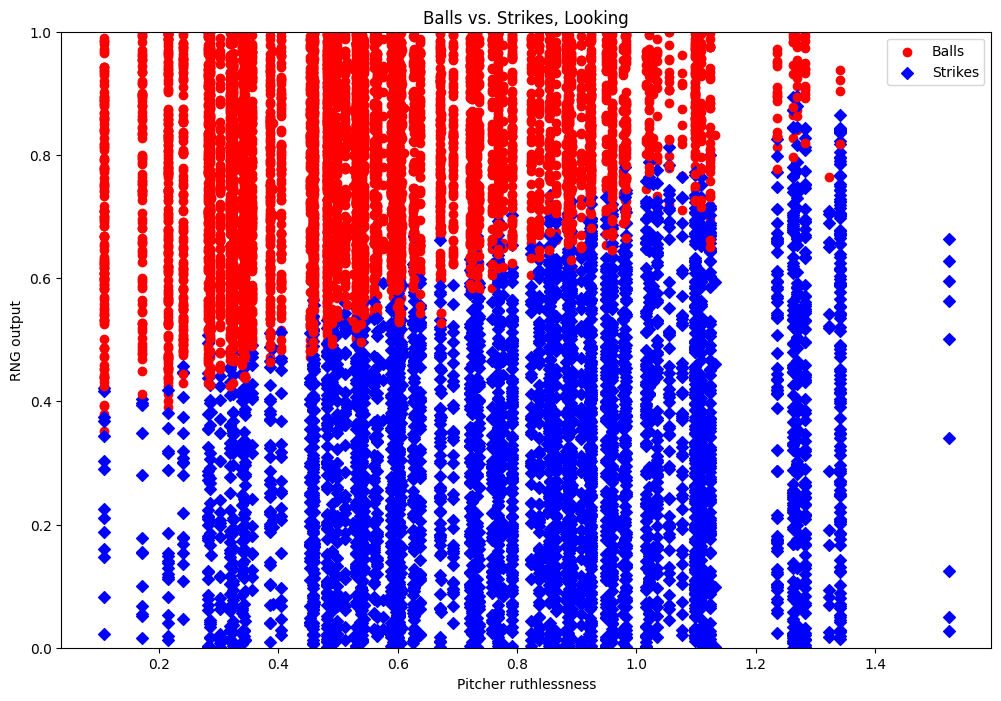
That’s a pretty nice line. Ruthlessness is definitely used to decide whether the pitch is inside the strike zone. But it’s obviously not the only thing, because we don’t have our clear separation. At this point we can make guesses about what else might be part of the formula, and check them with our plots. Or we can use math.
Support Vector Machines (SVMs) are a tool for finding an equation7 that separates a collection of points into two (or more) categories. We have a collection of points! And we wish to find an equation that separates them into two (or more) categories! We can feed our points into the SVM and tell it all the batter’s, pitchers, and stadium’s attributes, plus the RNG roll, plus whether the pitch was inside the strike zone, and it will spit an equation back out. Then we can plot the result against our RNG output and see if it’s more cleanly separated.
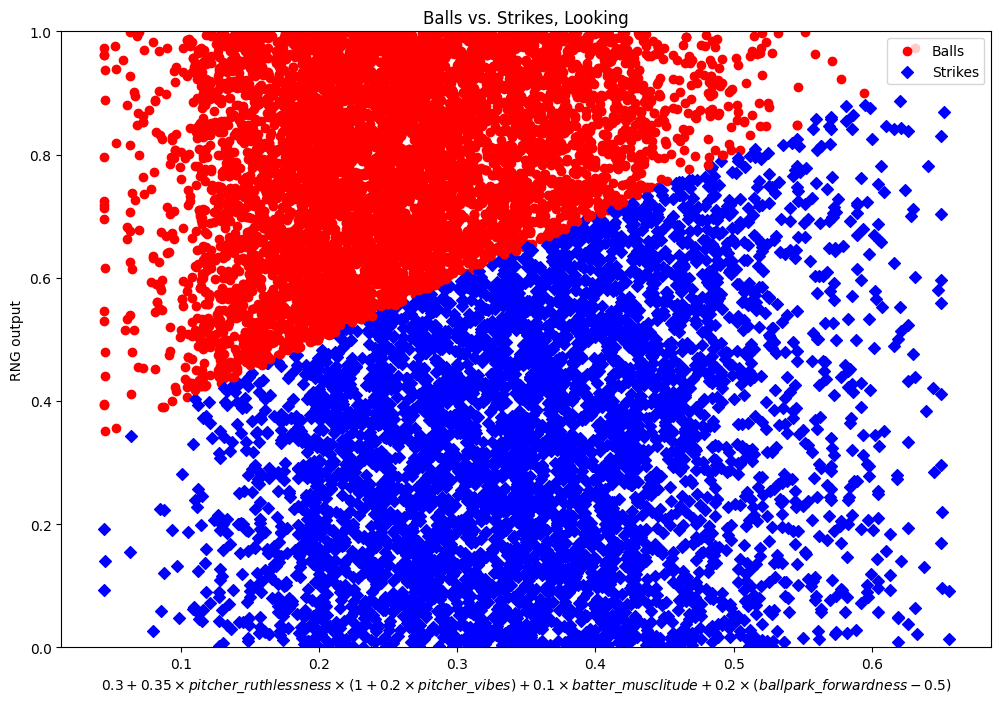
Et voila! That’s a perfect separation, telling us that the strikes equation is that big long one you see as the x-axis label. (It may look ragged along the border but that’s just the overlap of the dots and diamonds.)
Unfortunately, it’s not usually as easy as that. (In fact, it wasn’t even as easy as that this time. I “forgot” to tell you that I multiplied the pitcher’s ruthlessness by vibes first, and we put the subtraction of 0.5 from forwardness there manually to make the numbers nicer.) SVM can only find equations where all the terms are multiplied by some constants and then summed up. That’s enough for a few of the formulas, but many of them have more complicated terms that we have to guess and then feed into the SVM separately. That’s not even mentioning figuring out the mess of how mods affect attributes. It’s a lot of work, but at the end of it the SIBR twitter account can make tweets like this, so it’s all worth it. (Also it furthers our understanding of Blaseball and ability to make future tools, yadda yadda.)
A note on timing
This is only possible because we can get the RNG streamand the event stream in order. We have the RNG stream, but in order to do our analysis we also need to know in which order each game was processed on every tick. That order changes randomly in ways that for now appear to be unknowable (because they depend on other processes that were running on the same computer as the sim, and we don’t have visibility into those processes). The only reason this has been possible is that the Feed has timestamps that are precise to the millisecond and they’ve proved to be a reliable source for the precise event order. The Discipline Era doesn’t have the Feed and thus we have no way of finding out its precise event order. This means that, for now, we can’t perform the thorough research on Discipline that we’ve been doing on expansion. It’s possible that we could figure something out if we focus on it, but for now our research efforts are concentrated on Expansion.
Discoveries
From this research we’ve discovered a lot about how the sim works, including some of the contents of this article. Research is still ongoing, but there are a few highlights:
- Vibes are real. In general, a players attributes are multiplied by (1 + 0.2 * vibes), although there are many exceptions where that doesn’t apply. This means that players at peak vibe are 1 whole star better, and at min vibe are 1 whole star worse.
- Defense is also real. The sim picks a player on the defending team’s lineup to act as the defender when one is needed, which includes steal events and, surprisingly, home runs in addition to the expected flyout and ground out. But — and this is why we had such a hard time figuring defense out — when it needs to display which player caught the out it picks a different random player. So the player that it says caught the out is not the player whose attributes were used.
- Flinch is rigged. In addition to forcing the player to take a Strike before they can start swinging, it also makes the pitchers more likely to throw into the strike zone, so those pitches you’re forced to take are less likely to be Balls. Some of us suspect that this was not in effect in seasons 10 and 11, but we haven’t analyzed those seasons yet so can’t prove anything.
- There’s no party attribute. Players like Winnie Hess and Castillo Turner are just like that by random chance. This also goes for every other random effect, with the caveat that mods like Flickering and Unstable really do increase your chance of being hit by a weather event.
- From season 12 to 18, coldness does not appear to have been real. In season 19, however… stay tuned.
- The wave o’ babies: Starting in season 7, they started generating a new player on every single game update, just in case there was an incineration. If there wasn’t an incineration that player was just forgotten. There’s no real reason not to do it this way from a programming perspective — making a new baby is very cheap — but it’s bizarre to think about in this light.
Footnotes
-
After some important events, like a score or a party, there’s a longer gap than 5 seconds. Usually it’s 10 seconds but it can be up to 20 (for consumer attacks). ↩
-
Or a non-random number, if you want to get the same “random” numbers every time you run your program, which can be useful for testing. ↩
-
The reason it needs a strange number like 52 is interesting, and jan Misali has a good video about it. ↩
-
“Random” here meaning that each attribute was boosted by a random amount. Most boosts and unboosts do this, but peanuts and blooddrains are always 0.2 and 0.1 respectively. ↩
-
The technical way to say this is “not enough entropy”. ↩
-
The bird messages are picked from a list, and we know how to use a random number to pick a random thing from a list. If we know which item was picked we can work backwards to find out approximately what the random number was. The signature then consists of a low number, for the “does a weather event happen?” roll, followed by a number that chooses the correct message from the list. ↩
-
Technically a hyperplane, which is a math term and not a very fast aircraft. ↩