Featured Visualizations and Data Crimes
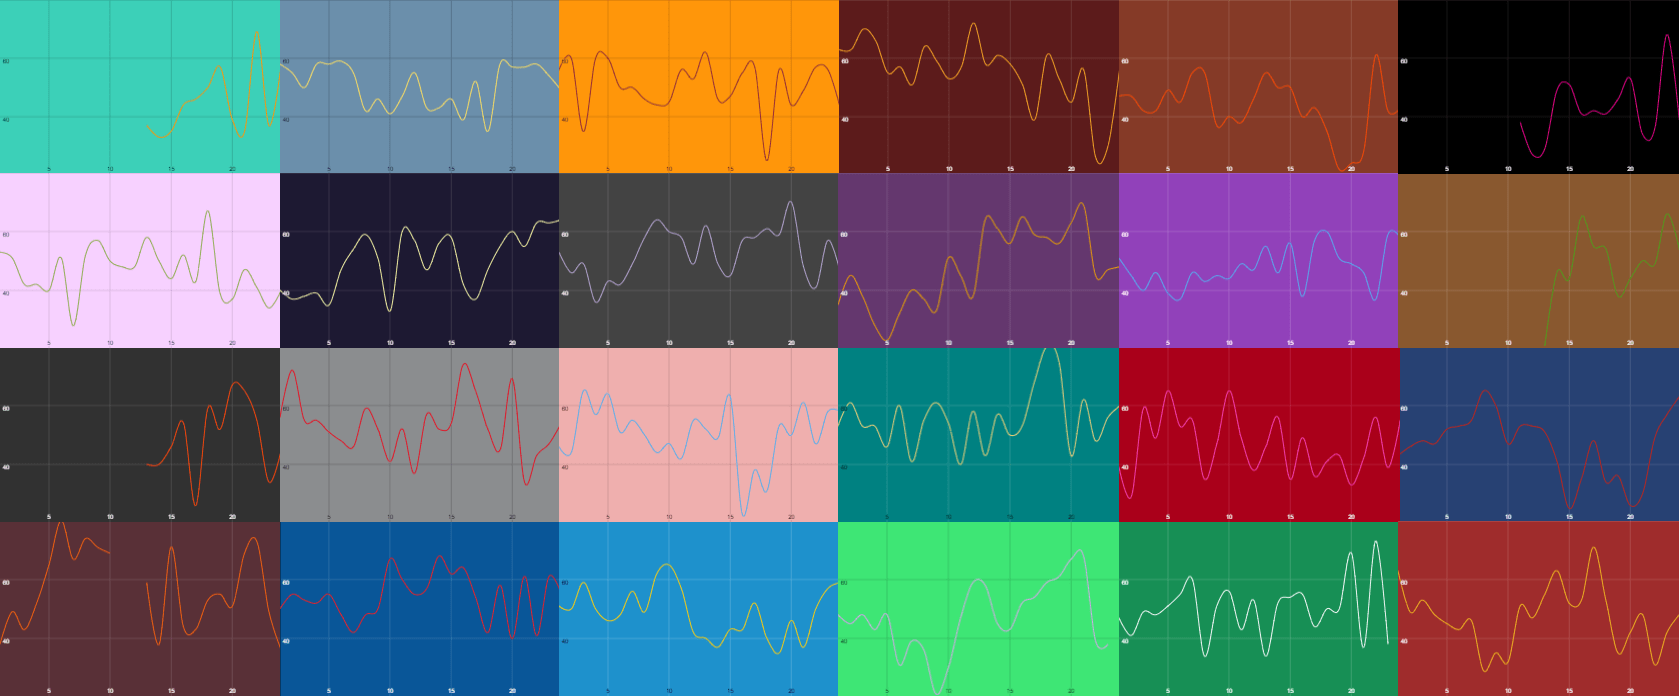
A seasonal non-loss chart for all 24 teams, Seasons 1-24. Divisions ordered top to bottom Wild High, Wild Low, Mild High, Mild Low, teams sorted alphabetically in each row.
Credit: @RoyaltyFreeAud/@MarinerFemboy
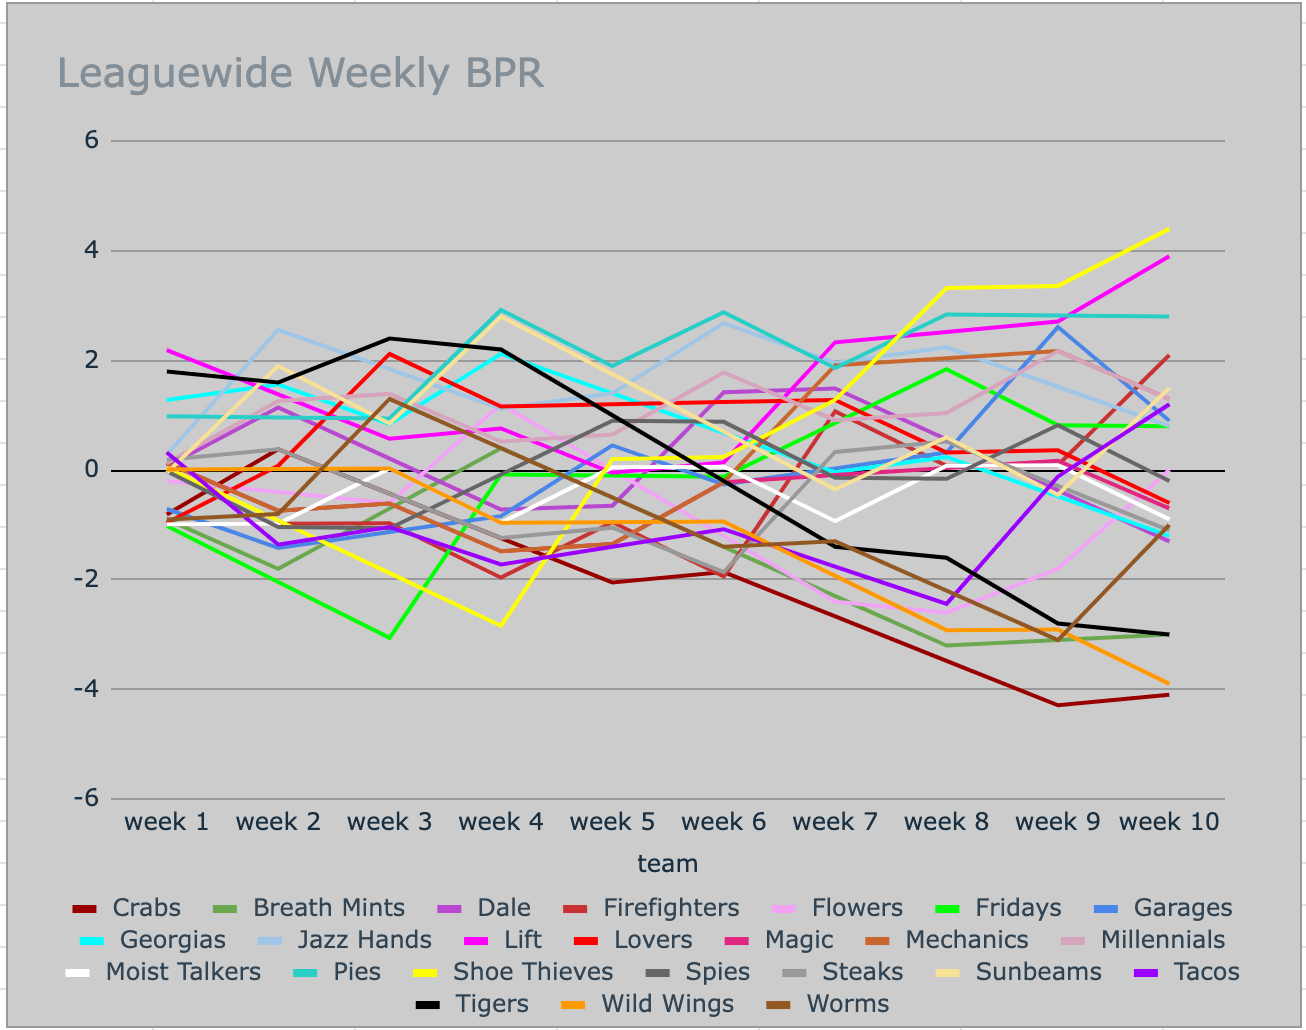
A line graph chart depicting Leaguewide Weekly BPR (Blorbos Plummet Ratio), a measurement of a team’s expected players fallen during Fall Ball based on S24 rosters vs. actual players fallen.
Credit: Lucien Muse#5961