Reaching In-Sights about Stuff: Getting A Broad Picture With Linear Modeling
The new era of Blaseball has come with a completely rewritten simulation with completely new attributes. Many of us in SIBR want to figure out what these attributes do! But it’s hard to know where to look first, or how to study them. And it’s tempting to want to figure out “the whole picture” for a given interaction or attribute. But I want to take a simpler approach. Rather than try to solve a question like “what does thwack do,” I want to get a broad sense of what attributes are related to various performance stats. To do this, let’s just use one of the simplest tools available to a statistician: linear regression.
I’m using R (through RStudio and the tidyverse ecosystem) for this post, because it’s designed for statistical analysis, it’s elegant at it, and I wanted to learn how to use it better. Plus it lets me write pretty reports like this using RMarkdown!
If you want to skip around, here are some section links:
Summary
Maybe you’re thinking, “why do you want me to look at all those numbers? Just tell me what does what.” Well, I can’t really tell you what does what, because correlation does not equal causation. But I can at least summarize the findings at the top. Here I have grouped the results by category “+Stat” means “this attribute is positively correlated with this statistic,” and “-Stat” means “this attribute is negatively correlated with this statistic.” Remember that this list is by no means comprehensive, or necessarily certain!
- Batting
- Sight: +BA, +OBP, +SLG. +BB/PA, -SO/PA.
- Thwack: +BA, +OBP, +SLG. +BB/PA, -SO/PA.
- Ferocity: +BA, +OBP, +SLG, strongly. +HR/H, -1B/H
- Pitching
- Control: -ERA, +SO9, -BB9
- Stuff: -ERA, +SO9, -H9, -HR9, (-BABIP??)
- Guile: -ERA, +SO9, -H9, -HR9, (-BABIP???)
- Running
- Dodge: didn’t find anything! ¯\_(ツ)_/¯
- Hustle: didn’t find anything! ¯\_(ツ)_/¯
- Stealth: +BA, +OBP, +SLG, somehow. +3B/H, +2B/H, -1B/H, somehow.
- Fielding
- Reach: +Plays Fielded
- Magnet: +Outs/Plays Fielded
- Reflex: -Advances Allowed, +Double Plays
- Vibes
- Thrive: it’s vibes lol
- Survive: it’s vibes lol. Saw a weak signal in HR/H, but have no idea what that means.
- Drama: it’s vibes lol
Data Loading & Cleaning
First, of course, we load the data. I’ve already done the work of joining the player stats from Abyline’s Season N1 stats spreadsheet to player attributes gathered from our https://api2.sibr.dev/mirror/players endpoint, and saved it as a CSV file. You can find a copy of this CSV file here.
library(tidyverse)
library(janitor)
library(sjPlot)

players_stats <- read_csv("player_stats_attrs_day90.csv")

# Clean column names and calculate columns we'll want later
players_stats <- players_stats %>%
  clean_names() %>%
  select(-heatmap) %>%
  mutate(
    # batting: walk rate and strikeout rate
    bb_pa = bb / pa,
    k_pa = k / pa,
    # batting: rate of types of hit
    x1b_h = x1b / hit,
    x2b_h = x2b / hit,
    x3b_h = x3b / hit,
    hr_h = hr / hit,
    xbh_h = (x2b + x3b) / hit,
    # fielding: rate of hit types allowed per hits, or per BIP
    x1b_h_f= x1b_alwd / hits_alwd,
    x1b_bip_f= x1b_alwd / totl_fields,
    x2b_bip_f= x2b_alwd / totl_fields,
    x3b_bip_f= x3b_alwd / totl_fields,
    adv_fields = adv_alwd / totl_fields,
    # fielder Manhattan distances from bases
    home_dist = abs(posx - 0) + abs(posy - 0),
    first_dist = abs(posx - 2) + abs(posy - 0),
    second_dist = abs(posx - 2) + abs(posy - 2),
    third_dist = abs(posx - 0) + abs(posy - 2),
    fifth_dist = abs(posx - 0) + abs(posy - 4),
    zeroth_dist = abs(posx - 4) + abs(posy - 0),
  )
Now we have a data frame with attributes, batting stats, pitching stats, and fielding stats all together. It’s much too wide to display usefully here, sorry.
head(players_stats)## # A tibble: 6 × 10²
## id name team_…¹ locat…² locat…³ posit…⁴ modif…⁵ overa…⁶ batti…⁷ pitch…⁸
## <chr> <chr> <chr> <chr> <dbl> <chr> <chr> <dbl> <dbl> <dbl>
## 1 df94a33… Pang… Moab H… LINEUP 0 [(3, 2… <NA> 2.45 3.89 1.60
## 2 ceb5606… Lond… Moab H… ROTATI… 1 [(0, 2… <NA> 2.95 3.03 3.15
## 3 9ba361a… Moon… Moab H… ROTATI… 4 [(5, 0… <NA> 2.38 2.53 3.67
## 4 ff5a37d… Dunn… Moab H… ROTATI… 3 [(0, 5… <NA> 2.53 1.17 4.64
## 5 51dab86… Crav… Moab H… LINEUP 7 [(0, 1… <NA> 2.35 3.48 2.88
## 6 8c02857… Will… Moab H… LINEUP 8 [(4, 1… <NA> 1.99 3.97 2.12
## # … with 92 more variables: defense_rating <dbl>, running_rating <dbl>,
## # vibes_rating <dbl>, sight <dbl>, thwack <dbl>, ferocity <dbl>,
## # control <dbl>, stuff <dbl>, guile <dbl>, reach <dbl>, magnet <dbl>,
## # reflex <dbl>, hustle <dbl>, stealth <dbl>, dodge <dbl>, thrive <dbl>,
## # survive <dbl>, drama <dbl>, posx <dbl>, posy <dbl>, pa <dbl>, ab <dbl>,
## # hit <dbl>, k <dbl>, bb <dbl>, x1b <dbl>, x2b <dbl>, x3b <dbl>, hr <dbl>,
## # fc <dbl>, dp <dbl>, tp <dbl>, sac <dbl>, rbi <dbl>, ba <dbl>, obp <dbl>, …Batting
From here, we can look at whatever we want. Let’s start simple: what attributes of the batter are related to their batting average?
s_ba <- summary(lm(ba ~ sight + thwack + ferocity + control + stuff + guile + dodge + hustle + stealth + reach + magnet + reflex + thrive + survive + drama, data = players_stats))
tab_model(s_ba, show.ci = FALSE, show.se = TRUE, digits=4, digits.p=2, p.style="scientific_stars")| ba | |||
|---|---|---|---|
| Predictors | Estimates | std. Error | p |
| (Intercept) | 0.0167 | 0.0124 | 1.81e-01 |
| sight | 0.0387 *** | 0.0068 | 4.19e-08 |
| thwack | 0.1064 *** | 0.0069 | 4.40e-36 |
| ferocity | 0.1715 *** | 0.0067 | 1.56e-66 |
| control | -0.0158 * | 0.0061 | 1.07e-02 |
| stuff | -0.0045 | 0.0062 | 4.70e-01 |
| guile | -0.0148 * | 0.0057 | 1.04e-02 |
| dodge | -0.0017 | 0.0060 | 7.74e-01 |
| hustle | 0.0088 | 0.0067 | 1.93e-01 |
| stealth | 0.0521 *** | 0.0068 | 8.04e-13 |
| reach | 0.0063 | 0.0063 | 3.16e-01 |
| magnet | 0.0126 * | 0.0061 | 3.92e-02 |
| reflex | 0.0055 | 0.0059 | 3.50e-01 |
| thrive | -0.0017 | 0.0065 | 7.99e-01 |
| survive | 0.0060 | 0.0065 | 3.54e-01 |
| drama | 0.0082 | 0.0064 | 2.00e-01 |
| Observations | 224 | ||
| R2 / R2 adjusted | 0.854 / 0.843 | ||
| * p<0.05 ** p<0.01 *** p<0.001 | |||
This looks over-fit to me, but there are several very strong dependencies. Let’s drop all but the most significant ones:
s_ba <- summary(lm(ba ~ sight + thwack + ferocity + stealth, data = players_stats))
tab_model(s_ba, show.ci = FALSE, show.se = TRUE, digits=4, digits.p=2, p.style="scientific_stars")| ba | |||
|---|---|---|---|
| Predictors | Estimates | std. Error | p |
| (Intercept) | 0.0225 ** | 0.0070 | 1.40e-03 |
| sight | 0.0369 *** | 0.0069 | 2.10e-07 |
| thwack | 0.1065 *** | 0.0070 | 2.45e-36 |
| ferocity | 0.1725 *** | 0.0068 | 1.50e-67 |
| stealth | 0.0533 *** | 0.0067 | 1.05e-13 |
| Observations | 224 | ||
| R2 / R2 adjusted | 0.838 / 0.835 | ||
| * p<0.05 ** p<0.01 *** p<0.001 | |||
The fit quality is almost identical with just four factors, so I think we’re justified dropping the others. My conclusion: Batting average is positively correlated with Ferocity, Thwack, Stealth, and Sight (in roughly that order). Stealth’s presence here is weird; I expected Hustle might matter just from the plain meaning of the word, but not stealth.
For the rest of this post I’ll skip to the “best” fit I have, but this is in general how I do these. I am not trying to make strong claims, so I am not worrying about whether my statistical practice is optimal. I’m also skipping showing the code; it all looks pretty much identical to the previous block, just with different variables, and different formatting arguments.
Onward to on-base percentage and slugging percentage:
| obp | |||
|---|---|---|---|
| Predictors | Estimates | std. Error | p |
| (Intercept) | 0.0785 *** | 0.0072 | 2.16e-22 |
| sight | 0.0473 *** | 0.0071 | 2.44e-10 |
| thwack | 0.0780 *** | 0.0072 | 3.93e-22 |
| ferocity | 0.1644 *** | 0.0070 | 6.54e-62 |
| stealth | 0.0508 *** | 0.0069 | 4.73e-12 |
| Observations | 224 | ||
| R2 / R2 adjusted | 0.803 / 0.799 | ||
| * p<0.05 ** p<0.01 *** p<0.001 | |||
| slg | |||
|---|---|---|---|
| Predictors | Estimates | std. Error | p |
| (Intercept) | -0.0753 *** | 0.0170 | 1.53e-05 |
| sight | 0.0853 *** | 0.0168 | 8.74e-07 |
| thwack | 0.2156 *** | 0.0171 | 7.35e-28 |
| ferocity | 0.3801 *** | 0.0165 | 2.44e-60 |
| stealth | 0.2203 *** | 0.0164 | 2.34e-30 |
| Observations | 224 | ||
| R2 / R2 adjusted | 0.825 / 0.822 | ||
| * p<0.05 ** p<0.01 *** p<0.001 | |||
Wow, it’s the same four attributes! For OBP, it’s Ferocity, Thwack, Stealth, and Sight (Sight is a bit stronger here than for BA). For SLG, it’s Ferocity, Stealth, Thwack, and Sight, with Ferocity being almost twice as strong as Stealth and Thwack, which are on par with each other. Interesting. Let’s do walk rate and strikeout rate next:
| bb/pa | |||
|---|---|---|---|
| Predictors | Estimates | std. Error | p |
| (Intercept) | 0.0592 *** | 0.0026 | 1.39e-58 |
| sight | 0.0159 *** | 0.0033 | 2.54e-06 |
| thwack | -0.0297 *** | 0.0033 | 1.44e-16 |
| Observations | 224 | ||
| R2 / R2 adjusted | 0.305 / 0.298 | ||
| * p<0.05 ** p<0.01 *** p<0.001 | |||
| k/pa | |||
|---|---|---|---|
| Predictors | Estimates | std. Error | p |
| (Intercept) | 0.3534 *** | 0.0055 | 6.59e-145 |
| sight | -0.0863 *** | 0.0068 | 8.26e-28 |
| thwack | -0.2095 *** | 0.0069 | 7.78e-81 |
| Observations | 224 | ||
| R2 / R2 adjusted | 0.840 / 0.838 | ||
| * p<0.05 ** p<0.01 *** p<0.001 | |||
They’re both just Sight and Thwack! Perhaps Sight helps you draw walks and avoid strikeouts, while Thwack makes both less likely. My guess is that higher Thwack batters put the ball into play more, which would make both these outcomes less frequent. Important note, though: The R2 for BB/PA is much lower than the other fits we’ve done so far, which suggests that most of the variation is not being captured by our variables. Which makes sense; I’m not considering pitcher attributes at all (I can’t, with this dependent variable).
So what’s up with Stealth from earlier? Stealth is important for “power”? That’s weird. Let’s look at the rates of types of hit relative to total hits, so HR/H, 3B/H, etc:
| hr/h | |||
|---|---|---|---|
| Predictors | Estimates | std. Error | p |
| (Intercept) | 0.0611 *** | 0.0092 | 2.09e-10 |
| ferocity | 0.1156 *** | 0.0115 | 9.23e-20 |
| survive | -0.0369 *** | 0.0110 | 9.53e-04 |
| Observations | 224 | ||
| R2 / R2 adjusted | 0.335 / 0.329 | ||
| * p<0.05 ** p<0.01 *** p<0.001 | |||
| 3b/h | |||
|---|---|---|---|
| Predictors | Estimates | std. Error | p |
| (Intercept) | 0.0044 | 0.0040 | 2.71e-01 |
| stealth | 0.1049 *** | 0.0075 | 3.12e-32 |
| Observations | 224 | ||
| R2 / R2 adjusted | 0.468 / 0.465 | ||
| * p<0.05 ** p<0.01 *** p<0.001 | |||
| 2b/h | |||
|---|---|---|---|
| Predictors | Estimates | std. Error | p |
| (Intercept) | 0.1719 *** | 0.0088 | 7.81e-50 |
| stealth | 0.4005 *** | 0.0165 | 1.41e-64 |
| Observations | 224 | ||
| R2 / R2 adjusted | 0.727 / 0.726 | ||
| * p<0.05 ** p<0.01 *** p<0.001 | |||
| 1b/h | |||
|---|---|---|---|
| Predictors | Estimates | std. Error | p |
| (Intercept) | 0.7568 *** | 0.0138 | 1.69e-130 |
| ferocity | -0.0905 *** | 0.0175 | 5.31e-07 |
| stealth | -0.4840 *** | 0.0175 | 8.21e-74 |
| Observations | 224 | ||
| R2 / R2 adjusted | 0.782 / 0.780 | ||
| * p<0.05 ** p<0.01 *** p<0.001 | |||
I’ve cut down variables pretty aggressively here. The R2 values aren’t all that high for some of these, no matter how many batter attributes I include. Clearly, it’s not just up to the batter---the pitcher and defense should matter for these! The best I’ve got is the observation that Ferocity increases home run rate, Stealth increases double and triple rate, and both of those, in turn, decrease single rate the same amount that they increase the other outcomes. There is also my first trace of a vibes attribute, as Survive seems to be showing up in the home run rate. It’s a negative factor, though, which I don’t understand. I have no current model for how vibes might work, though, so I’m just glad to see one of the vibes attributes stick around in anything, even if it’s barely below the 0.001 significance threshold for the weakest fit in this set. As another friend put it, “someone in the data set hits home runs, and we think they might have less Survive, but we’re not sure” is probably the most you can conclude from that relationship.
Pitching
Now let’s move on to pitching stats! First, perhaps the most general pitching stat, ERA:
| era | |||
|---|---|---|---|
| Predictors | Estimates | std. Error | p |
| (Intercept) | 6.4636 *** | 0.2177 | 9.27e-56 |
| control | -1.6023 *** | 0.2322 | 3.00e-10 |
| stuff | -2.3187 *** | 0.2174 | 6.99e-19 |
| guile | -1.3332 *** | 0.2373 | 1.37e-07 |
| Observations | 119 | ||
| R2 / R2 adjusted | 0.657 / 0.648 | ||
| * p<0.05 ** p<0.01 *** p<0.001 | |||
ERA has a strong relationship with all 3 pitching attributes. In order of importance, Stuff > Control > Guile, though it’s fairly balanced. The R2 of 0.65 suggests that there is a lot more going on than just this, which is good, because of course there is.
Now, let’s look at rate stats for outcomes. Strikeouts per 9 innings:
| so 9 | |||
|---|---|---|---|
| Predictors | Estimates | std. Error | p |
| (Intercept) | 1.5499 *** | 0.2293 | 6.03e-10 |
| control | 1.6609 *** | 0.2446 | 5.18e-10 |
| stuff | 4.8418 *** | 0.2290 | 1.99e-41 |
| guile | 2.5841 *** | 0.2500 | 4.13e-18 |
| Observations | 119 | ||
| R2 / R2 adjusted | 0.857 / 0.853 | ||
| * p<0.05 ** p<0.01 *** p<0.001 | |||
Strikeouts seem to be Stuff > Guile > Control. Plausibly, “better stuff” is harder to hit, and “trickier pitches” are as well. To look deeper at this, if I had a per-pitch data set I would want to investigate swinging strikes with a logistic regression.
Now, walks per 9 innings:
| bb 9 | |||
|---|---|---|---|
| Predictors | Estimates | std. Error | p |
| (Intercept) | 4.5057 *** | 0.2168 | 9.51e-41 |
| control | -5.0199 *** | 0.2313 | 1.76e-42 |
| stuff | 0.5268 * | 0.2165 | 1.65e-02 |
| guile | -0.3886 | 0.2363 | 1.03e-01 |
| Observations | 119 | ||
| R2 / R2 adjusted | 0.812 / 0.808 | ||
| * p<0.05 ** p<0.01 *** p<0.001 | |||
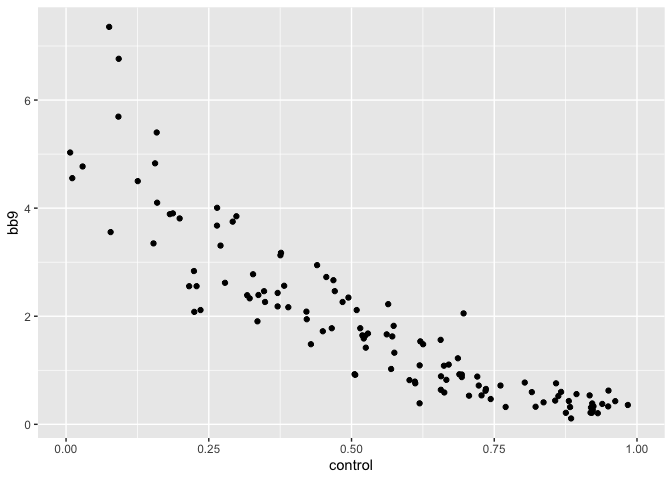
You heard it here, folks; Stuff increases walks. Seriously though, it’s really just Control. If you can throw strikes, you won’t walk people. Remarkable! If you plot the relationship, it’s quite clear, and also not actually linear (I should do another post that just has a bunch of plots, honestly).
Let’s look at hits per 9 innings next:
| h 9 | |||
|---|---|---|---|
| Predictors | Estimates | std. Error | p |
| (Intercept) | 11.0716 *** | 0.3107 | 2.52e-64 |
| stuff | -3.3510 *** | 0.3629 | 1.48e-15 |
| guile | -2.0845 *** | 0.3934 | 5.62e-07 |
| Observations | 119 | ||
| R2 / R2 adjusted | 0.527 / 0.519 | ||
| * p<0.05 ** p<0.01 *** p<0.001 | |||
Hits depend on Stuff and Guile, it seems. We’re barely above 0.5 R2, though, so clearly the pitcher is not the only determinant of this; the batter and defense factors will matter a lot too.
Now, how about home runs per 9? Those probably don’t depend on the defense.
| hr 9 | |||
|---|---|---|---|
| Predictors | Estimates | std. Error | p |
| (Intercept) | 1.4010 *** | 0.0601 | 1.45e-45 |
| stuff | -0.5736 *** | 0.0702 | 4.39e-13 |
| guile | -0.2750 *** | 0.0761 | 4.50e-04 |
| Observations | 119 | ||
| R2 / R2 adjusted | 0.436 / 0.426 | ||
| * p<0.05 ** p<0.01 *** p<0.001 | |||
Home run rate also depends on Stuff and Guile, but less strongly: only about 0.425 R2. I could be glib and say that 40% of home runs is the pitcher, 40% is the batter, and 20% is, I don’t know, the pitcher and batter heatmaps. But I won’t say that. You can’t pin that on me!
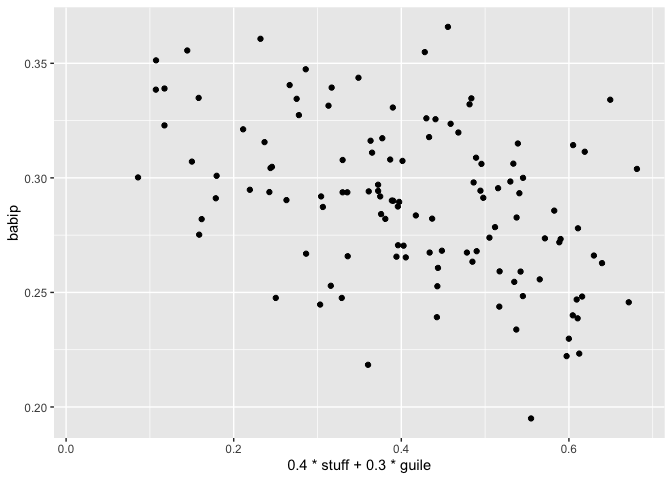
Last fit for this section: batting average on balls in play (BABIP). In the Beta-era simulation, pitchers had a pretty significant impact on this, through Unthwackability. Do we still see that sort of impact in the new simulation?
| babip | |||
|---|---|---|---|
| Predictors | Estimates | std. Error | p |
| (Intercept) | 0.3301 *** | 0.0103 | 3.46e-59 |
| control | 0.0043 | 0.0110 | 6.96e-01 |
| stuff | -0.0410 *** | 0.0103 | 1.19e-04 |
| guile | -0.0307 ** | 0.0112 | 7.22e-03 |
| Observations | 119 | ||
| R2 / R2 adjusted | 0.190 / 0.169 | ||
| * p<0.05 ** p<0.01 *** p<0.001 | |||
This fit is quite rough. Stuff has the strongest relationship to BABIP of the three pitching attributes, but…just look at it. It’s not strong. But maybe it’s not nothing? It’s definitely nowhere near as strong as Unthwackability used to be, though.
Fielding
The fielding stats that we have in this data set aren’t very sophisticated, so we can only do so much with them. But we can at least get a start, here. Besides, it’s much harder to interpret a complicated derived stat regressed against attributes, because there is so much more going on. Let’s start with a super basic one: how many plays will a fielder actually get?
| totl fields | |||
|---|---|---|---|
| Predictors | Estimates | std. Error | p |
| (Intercept) | 108.6787 *** | 17.2095 | 1.47e-09 |
| reach | 302.2577 *** | 19.3756 | 1.92e-37 |
| magnet | 8.6891 | 18.8928 | 6.46e-01 |
| reflex | 11.5943 | 18.1542 | 5.24e-01 |
| Observations | 224 | ||
| R2 / R2 adjusted | 0.527 / 0.521 | ||
| * p<0.05 ** p<0.01 *** p<0.001 | |||
It seems that total balls fielded only depends on Reach. And this is obviously quite incomplete; R2 of 0.5 is Not So Great.
The next natural question to ask is, what about the fielder’s rate of getting outs from balls in play (i.e, outs/plays)?
| outs/plays | |||
|---|---|---|---|
| Predictors | Estimates | std. Error | p |
| (Intercept) | 0.6437 *** | 0.0045 | 1.12e-219 |
| magnet | 0.1921 *** | 0.0077 | 1.52e-66 |
| Observations | 224 | ||
| R2 / R2 adjusted | 0.738 / 0.737 | ||
| * p<0.05 ** p<0.01 *** p<0.001 | |||
This seems to just be related to Magnet. This at least has more explanatory power than Reach did above (I guess, if you’re willing to interpret R2 that way, which is probably wrong in some way that I can’t explain properly?).
Beyond this, the stats I have here stop being very amenable to this kind of analysis. The problem is, they’re mostly all the same. The more Reach you have, the more plays you’re involved in, so the more outs you get, but also the more “hits you give up”, the more “runs you allow”, etc. Having more Magnet seems to increase the “good” defensive outcomes and decrease the “bad” ones. None of that adds any insight.
But there is one more thing I want to try. Let’s get bold and look at double plays started for each fielder. Thanks to my buddy Nate (@GraveError on Twitter), who saw these trends when looking at high-double-play fielders and suggested them to me.
| double plays | |||
|---|---|---|---|
| Predictors | Estimates | std. Error | p |
| (Intercept) | 8.3421 *** | 1.0772 | 3.44e-13 |
| reflex | 6.1571 *** | 1.2423 | 1.43e-06 |
| first dist | -1.9730 *** | 0.1893 | 5.94e-21 |
| Observations | 224 | ||
| R2 / R2 adjusted | 0.383 / 0.378 | ||
| * p<0.05 ** p<0.01 *** p<0.001 | |||
Reflex is the only defense attribute that contributes here. The other factor I’ve included, first_dist, is ”Manhattan distance from the fielder’s position to first base.” Fielders with higher Reflex turn more double plays, and fielders closer to first base turn fewer---perhaps they choose to take the out at first more often. This fit only captures ~40% of the variance, so it’s sketchy, but I’m honestly impressed it even does that well. I tested the distance to every other base as well (yes, including 0th and 5th), and distance to first is by far the best predictor of the set.
By the way, I didn’t find even a hint of a relationship between batter attributes and grounding into double plays. It’s probably mostly on the defense, I guess?
Let’s finish up by looking at runner advances allowed, divided by balls fielded:
| advances/fields | |||
|---|---|---|---|
| Predictors | Estimates | std. Error | p |
| (Intercept) | 0.0561 *** | 0.0028 | 1.14e-50 |
| reflex | -0.0197 *** | 0.0033 | 6.48e-09 |
| home dist | -0.0034 *** | 0.0004 | 1.83e-15 |
| Observations | 224 | ||
| R2 / R2 adjusted | 0.328 / 0.322 | ||
| * p<0.05 ** p<0.01 *** p<0.001 | |||
This is not independent of double plays, of course; if you successfully turn double plays you prevent runners from advancing. But it might also include ability to “hold the runners,” though that is very speculative. I need to stress: this is probably the sketchiest fit in this entire post. Including the distance from home plate increases the R2 from 0.1 to 0.3, which is kind of wild given how small that coefficient is. But regardless, the hint of a signal here is something like this: Reflex might be involved in handling baserunners, and infielders might have a better shot at holding runners than outfielders.
Conclusion
Well, that’s about it for now. I haven’t covered every possible stat you could run against attributes, but hopefully my results are useful to give you an idea of what is likely at play here. There are tons of ways to build on this sort of basic picture, many of which are already under way over in the SIBR discord (not to imply that people are building on my work specifically; we’ve been doing a lot of work in parallel). Here are few things that I’m currently interested in:
- More complex regressions for certain stats: simple counting stats might be better served by using the log of the data (for reasons involving words like “heteroskedasticity”), or perhaps a Poisson regression.
- “Geography” (defender positioning and hit location) and its effects on defense: there is now an entire channel in SIBR with this name, where we have been analyzing these factors. It is clearly very important, and I have only barely touched it in this post.
- Batter and pitcher “Zones”: kjc9 in the SIBR discord (also
@kjc9@hachyderm.ioon Mastadon) did some fantastic work using a logistic-regression-based ML model, looking at (an indirect measure of) hit location and how it relates to the “heatmaps” that batters and pitchers all have. A few days ago I took his results and combed through them carefully, and I think I found some interesting patterns, but it is very complex and noisy right now. Two players got their Zones “maxed out” in the NEW Season 1 Election, so hopefully they have noticeable outcome differences that we can investigate at the end of NEW Season 2… - Per-PA or per-pitch analysis: look at the data on a “does a certain outcome happen or not, yes/no” level. This requires logistic regression, which is its own can of worms, but has in the past been very successful at getting insight into the Beta simulation (and has had some work done on it for the new sim already, by kjc9 and others).
If you’re interested in contributing to our collective understanding of NEW Blaseball, I invite you to go to the SIBR Discord and grab the Research Access role. There are many awesome people in that section of the server who have been really helpful to me and others in getting started doing research and analysis on Blaseball! We love to see people trying to figure stuff out, even if it’s “just a first attempt” or whatever.